3.4 实践学习体验:新冠疫情数据的可视化 
由于Python的特性,很多互联网高手都开发了支持各种类型应用的库函数。在实践机器学习算法的过程中,大部分的数据源都可以通过网络获得,这次的流行数据也是如此。因此,用Python读取数据的过程演示如下。
# pd.read_csv is the function to save the csv format file from web url.
pd.read_csv('https://github.com/datasets/covid-19/blob/master/data/countries-aggregated.csv ', parse_dates=['Date'])
countries = ['Canada', 'Germany', 'United Kingdom', 'US', 'France', 'China']
其中pd为提供的库,命令函数为read.csv(URL),例如,直接进入URL抓取网络档案(逗号分隔的文本文件),字段名为日期,分类国家为加拿大、德国、英国、美国、法国和中国。
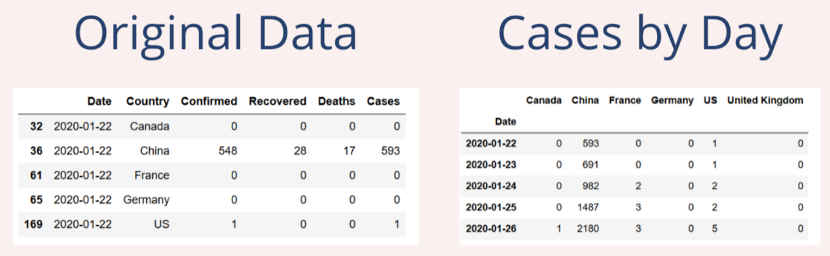
图18.左边是原始数据,右边是读取后的格式化数据,按日期排序
# The definition of graphic colors and styles to present country data in different colors
colors = {'Canada':'#045275', 'China':'#089099', 'France':'#7CCBA2', 'Germany':'#FCDE9C', 'US':'#DC3977', 'United Kingdom':'#7C1D6F'}
plt.style.use('fivethirtyeight')
# Create Visual Appearance, including graphic size, arrangement
plot = covid.plot(figsize=(12,8), color=list(colors.values()), linewidth=5, legend=False)
根据网页上的描述,对方提供的Python库只需5分钟就可以完成程序训练,结果如图19所示。整个过程简单明了。代码行数不到20行,数据操作仅用了不到3行,其余均为对图片设计的处理。
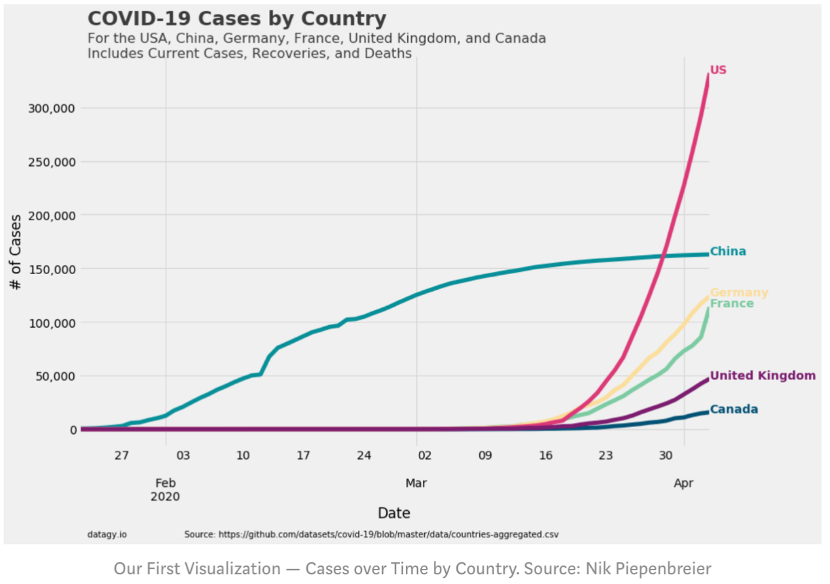
图19.数据的可视化
测试
请在我们的jupyter服务器上测试代码并进行练习,默认账户名yuanzhuo,默认密码yuanzhuo. 请将kernel设置为conda-yuanzhuo. Yuanzhuo Online Code Platform
测验
推理的方法是( )
COVID-19流行病期间,AI如何应用于医疗临床诊断?